

DATA DROP - BROOKLYN PRICE CUTS
Last updated: November 5, 2026

This post is part of the Decode Data Drop, my weekly series where I pull the real numbers behind New York real estate and share what they actually mean for buyers. Receipts, not vibes. A new drop goes up every Thursday on Instagram, so follow along at @katiekeatejohnson to catch the next one.
Every fall buyers ask me the same thing: are the price cuts I'm seeing real, and is it smarter to wait for spring? It's hard to answer from listing sites, because they show you one cut at a time and never tell you how long a listing sat first or what happens to supply once the holidays hit.
So I pulled every Brooklyn price cut from the last week, how long each listing had been on the market before it cut, and five years of monthly new listings and contracts for Brooklyn and Manhattan. Here's what the data shows about who's cutting, and why the next eight weeks favor buyers.
Quick Overview
182 Brooklyn listings cut their price from Oct 29 to Nov 4, 2026, up 14% from the week before.
9 weeks is the typical time on market before a cut. 43% of this week's cuts were listed in August or September.
57% fewer new listings come to market in December than in September, while contracts barely move. In Manhattan, December deals outnumber new listings.
The Numbers
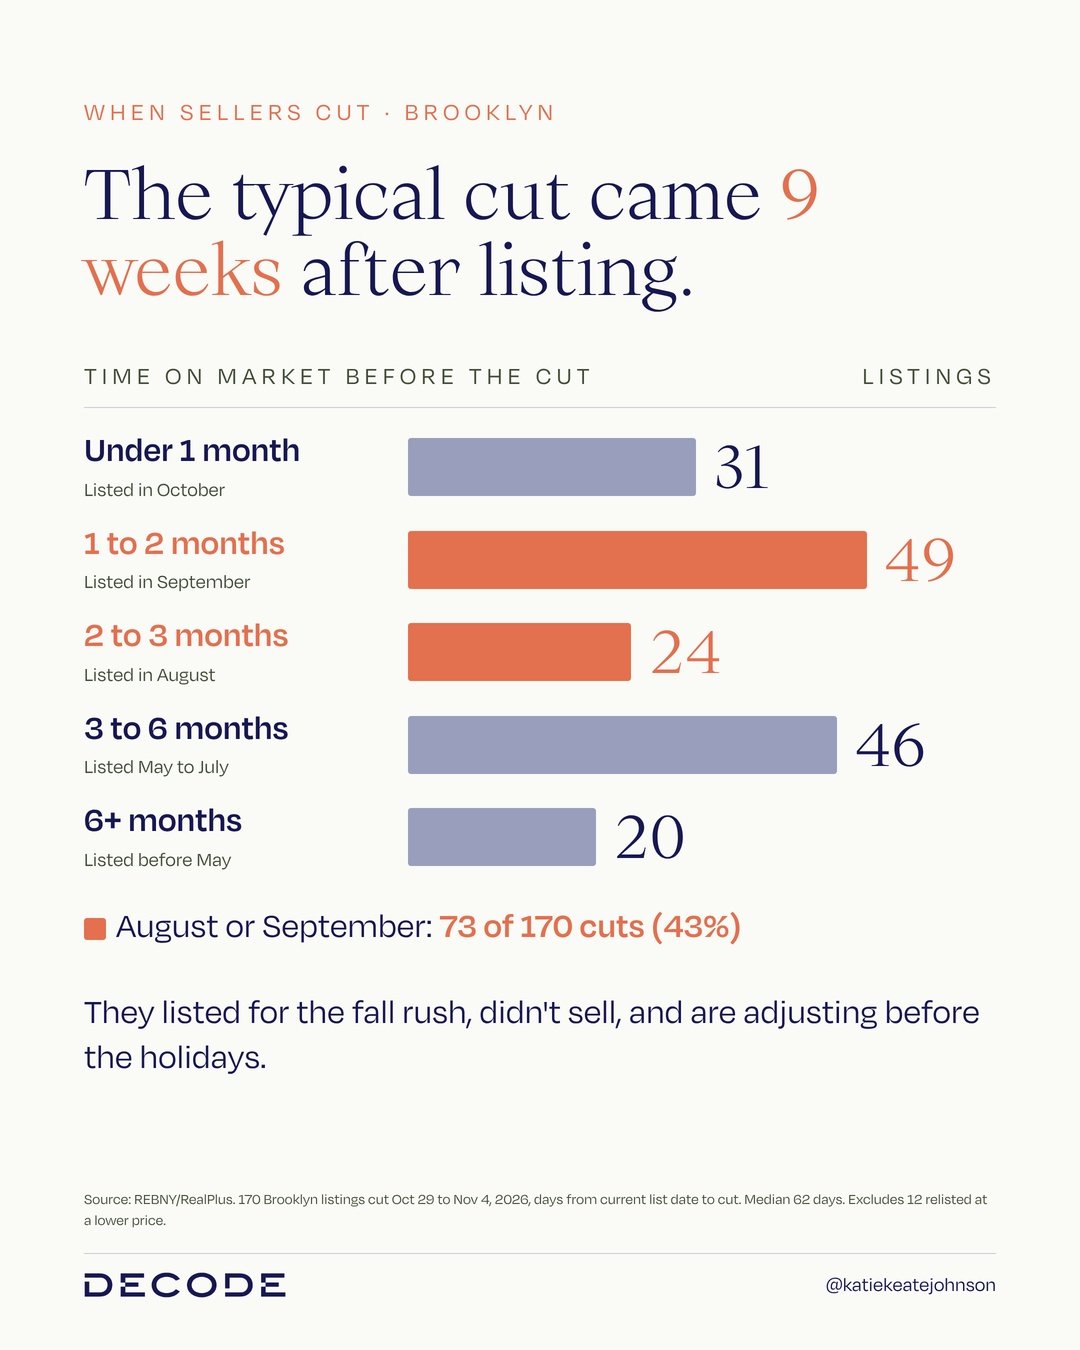
The typical cut came 9 weeks after listing
Brooklyn · 170 listings cut Oct 29 to Nov 4, 2026 · time on market before the cut
The median listing had been on the market 62 days when it cut its price. The biggest group came on in September for the fall rush, didn't sell, and is now adjusting before the holidays.
Under 1 month (listed in October): 31
1 to 2 months (listed in September): 49
2 to 3 months (listed in August): 24
3 to 6 months (listed May to July): 46
6+ months (listed before May): 20
That's 73 of 170 cuts (43%) from listings that came on in August or September.
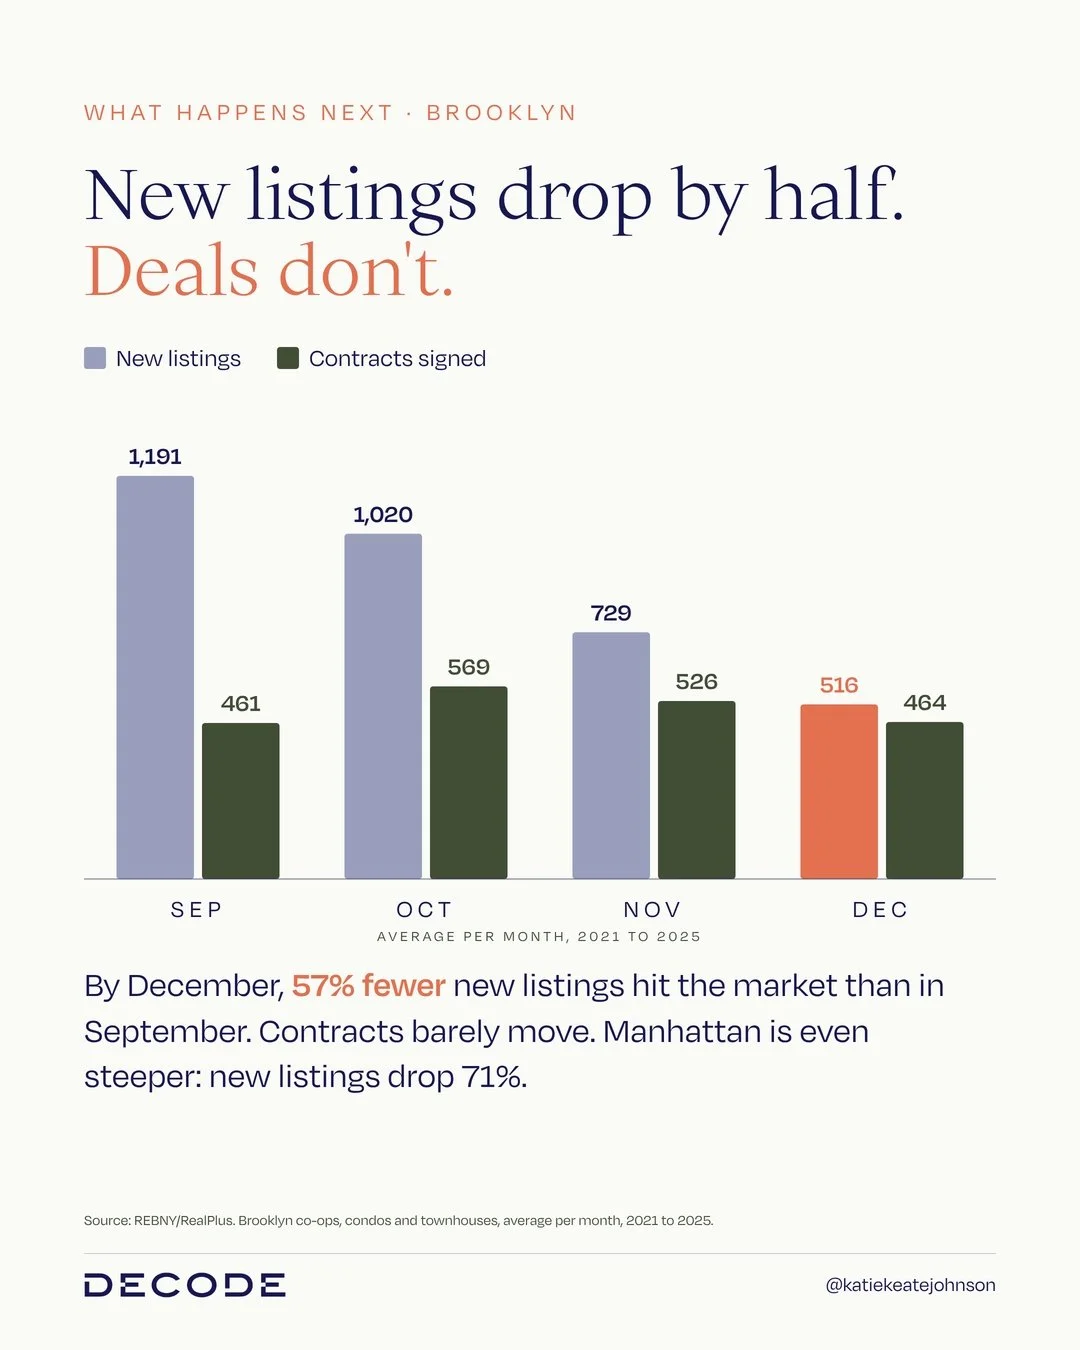
New listings drop by half by December. Deals don't.
Brooklyn · co-ops, condos and townhouses · average per month, 2021 to 2025
By December, 57% fewer new listings hit the market than in September, but contracts signed barely change. In Manhattan the drop is even steeper: new listings fall 71%.
September: 1,191 new listings, 461 contracts
October: 1,020 new listings, 569 contracts
November: 729 new listings, 526 contracts
December: 516 new listings, 464 contracts
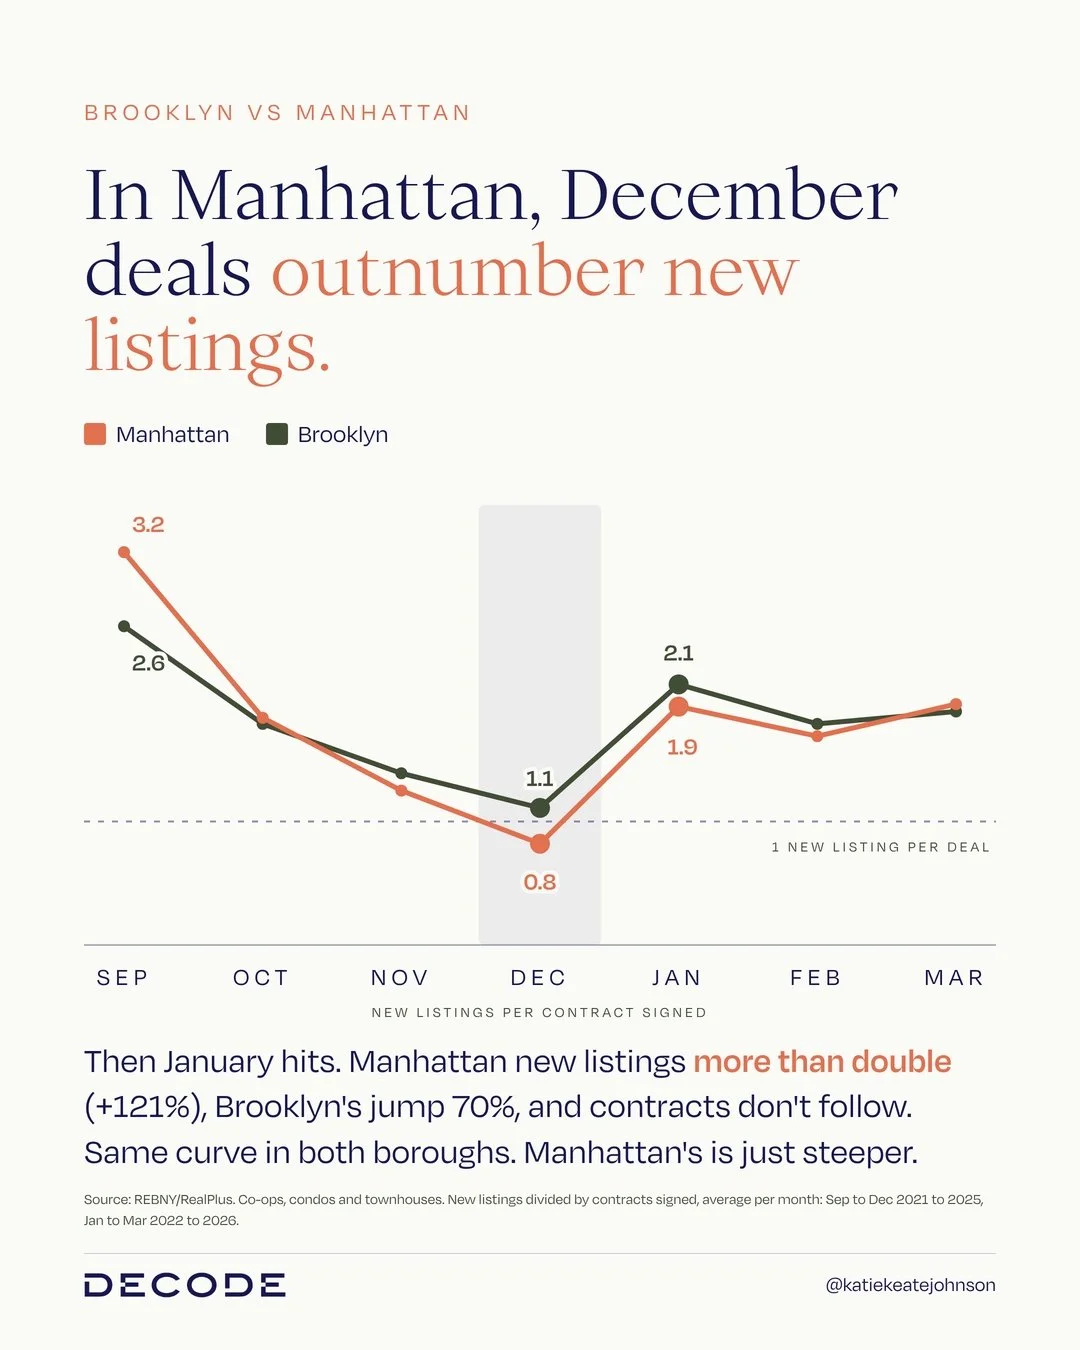
In Manhattan, December deals outnumber new listings
Brooklyn and Manhattan · new listings per contract signed · September to March
December is the low point in both boroughs. Then January hits: new listings jump and contracts don't follow, so every seller is competing with more listings for the same buyers.
December: Manhattan 0.8 new listings per contract, Brooklyn 1.1
January: Manhattan 1.9, Brooklyn 2.1
New listings, December to January: Manhattan +121%, Brooklyn +70%
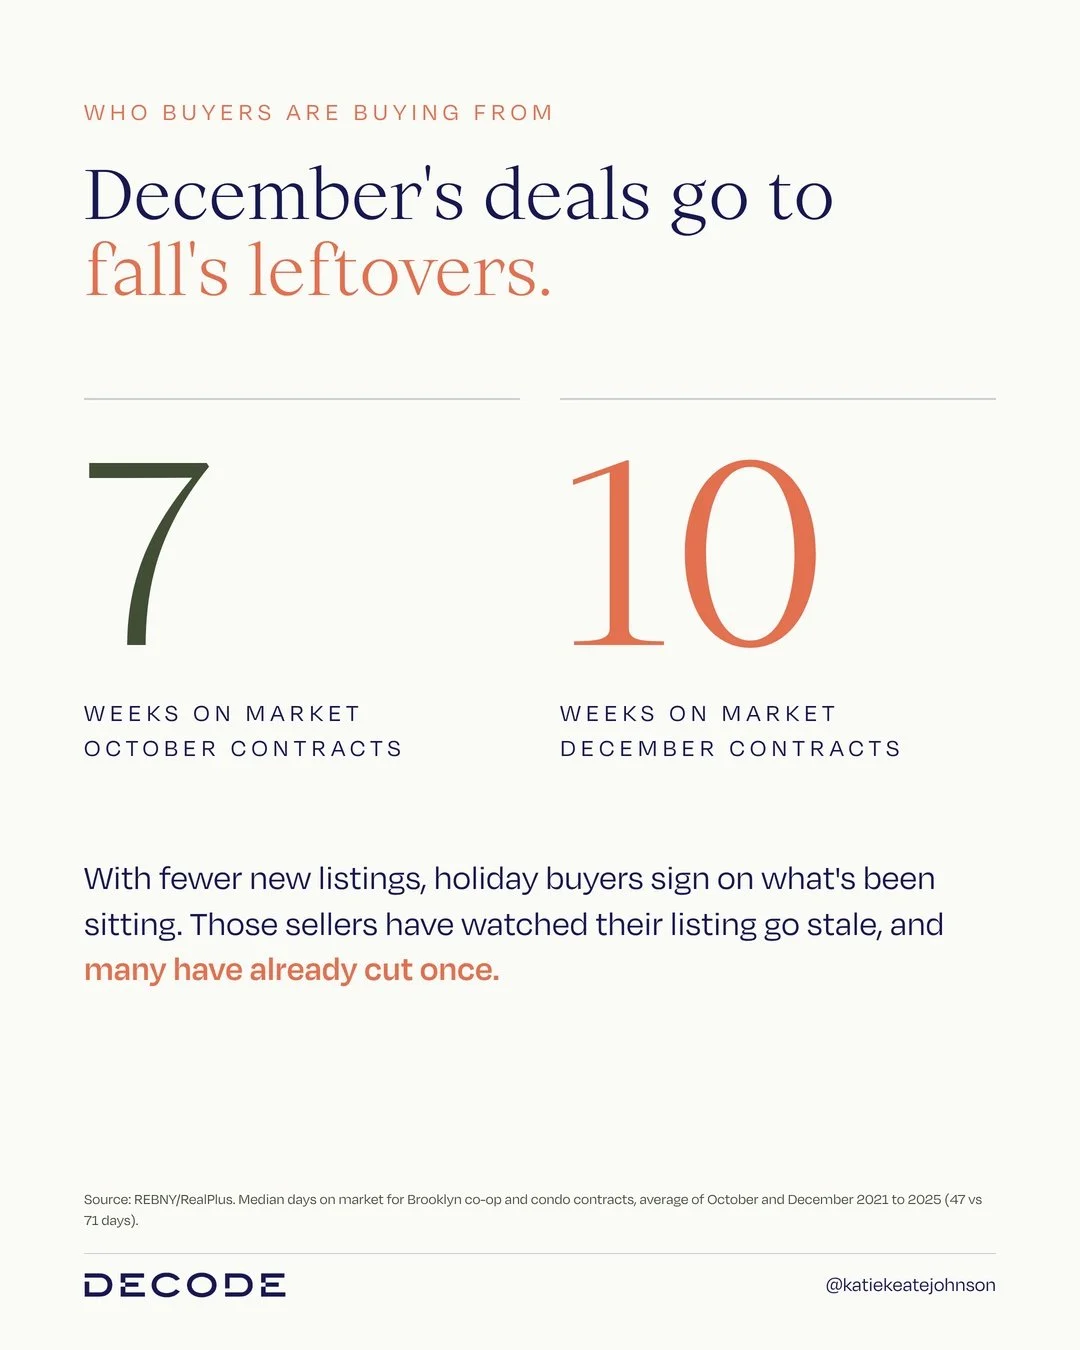
December's deals go to fall's leftovers
Brooklyn · co-op and condo contracts · median days on market, 2021 to 2025
With fewer new listings, holiday buyers sign on what's been sitting. December contracts had been on the market about 10 weeks (71 days), compared with about 7 weeks (47 days) for October contracts.
Good to Know
What counts as a price cut: Brooklyn co-op, condo and townhouse listings with a price reduction dated in the week. Closed sales are excluded, because RealPlus records a sale that closed below ask as a price change.
One cut per listing: RealPlus keeps only each listing's most recent price change, so a listing that cut twice counts in the week of its latest cut. That makes the week-over-week change approximate, somewhere around 10% to 14%.
Time on market: measured from the current list date to the cut. 12 listings that were relisted at a lower price were left out.
Medians, not averages: days on market figures are medians, so one listing that sat for two years doesn't skew them.
Why five-year averages: contracts are often reported weeks after they're signed, so this month's count runs low. The seasonal pattern uses monthly averages: September to December from 2021 to 2025, January to March from 2022 to 2026.
Source: REBNY/RealPlus.
-
If you're buying, the opportunity is in what's sitting. Filter for anything that's been on the market 60 days or more and ask what it was originally listed at. A seller who has already cut once is telling you they're ready to talk, and December is when those sellers sign.
Don't wait for spring to start. New listings jump 70% in January and more than double by March. You'll have more to look at, but so will every other buyer, and the listings that have been sitting since September will either sell or come off the market.
If you're selling, price it for week one, not week nine. The buyers who see your listing fresh are the ones who move. And if you've been on since September, adjusting before the holidays beats competing with the January wave.
What questions do you want real answers for?
Send me the question you can't get a straight answer on, about a building, a neighborhood, or the market. I'll dig into the data and reply with real numbers, no sales pitch. The best ones become a future Data Drop.
KEEP EXPLORING