

DATA DROP - RENTAL INVENTORY
Last updated: November 3, 2026
This post is part of the Decode Data Drop, my weekly series where I pull the real numbers behind New York real estate and share what they actually mean for buyers. Receipts, not vibes. A new drop goes up every Thursday on Instagram, so follow along at @katiekeatejohnson to catch the next one.
Every family I work with asks some version of this: where did all the 3-bedrooms go? It feels like there are fewer than there used to be, but most people only have a hunch.
So I pulled ten years of monthly rental listings for Brooklyn and Manhattan, first for 3-bedrooms and then for every unit type, and lined them up with the city’s own vacancy numbers. The 3-bedrooms are not hiding. They are just not coming to market, and the rest of the rental market is tight too.
Quick Overview
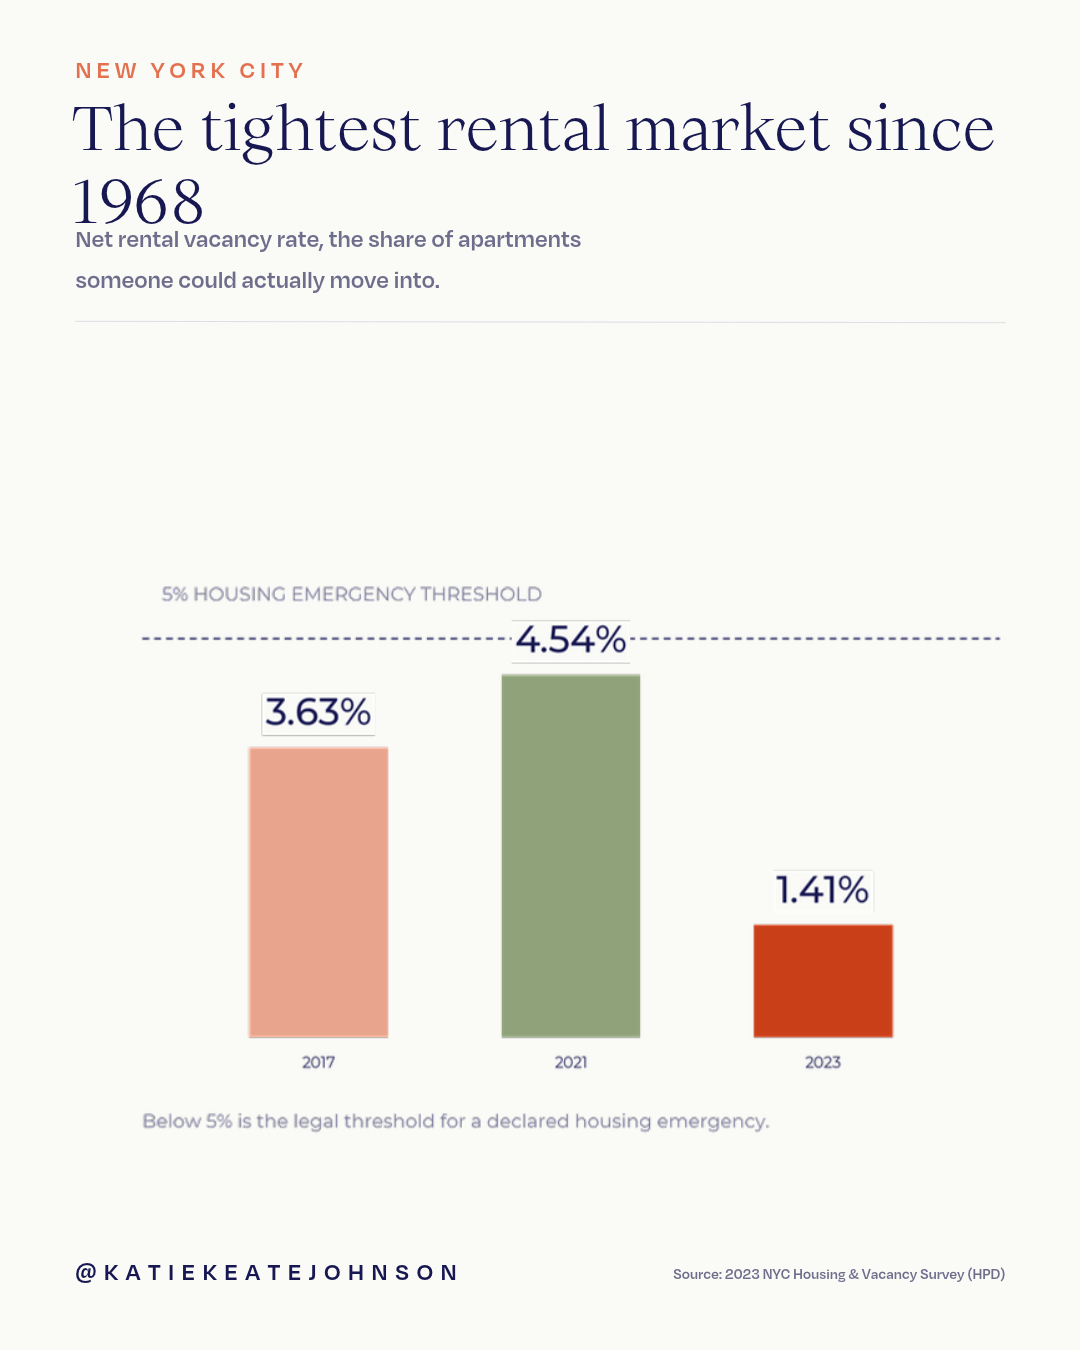
1.41% is New York City’s rental vacancy rate, the lowest since 1968. For apartments renting under $2,400, it is below 1%.
A quarter of Brooklyn’s usual 3-bedroom listings are not coming to market. Park Slope is at 51% of its pre-2020 normal.
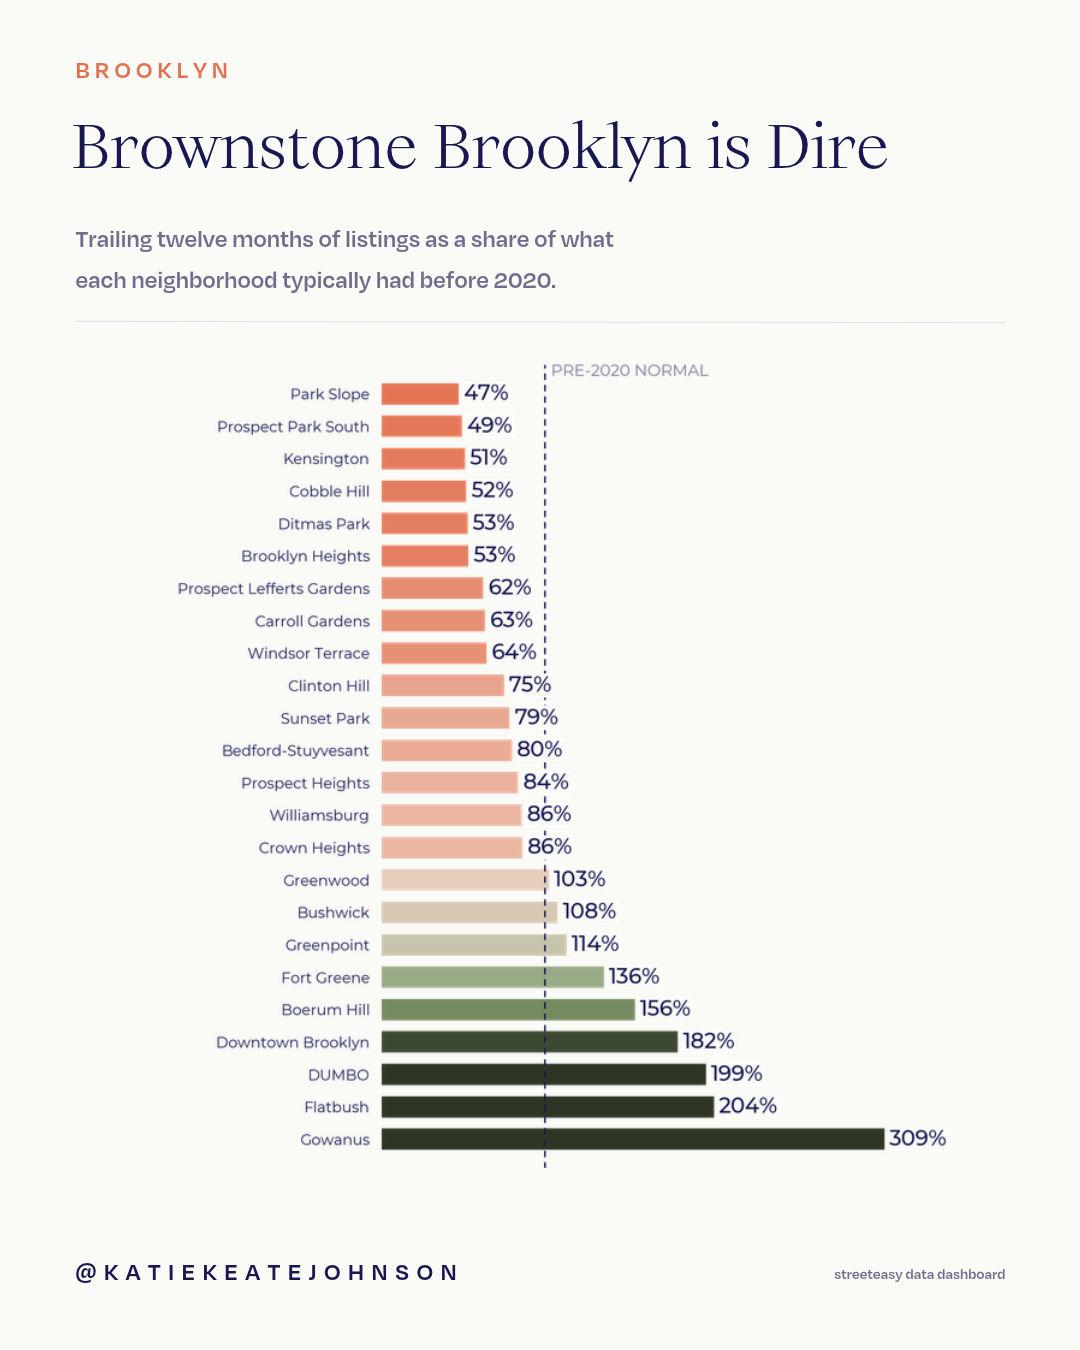
93% vs. 71%: Brooklyn’s overall rental listings are close to their pre-2020 normal, Manhattan’s are not.
The Numbers
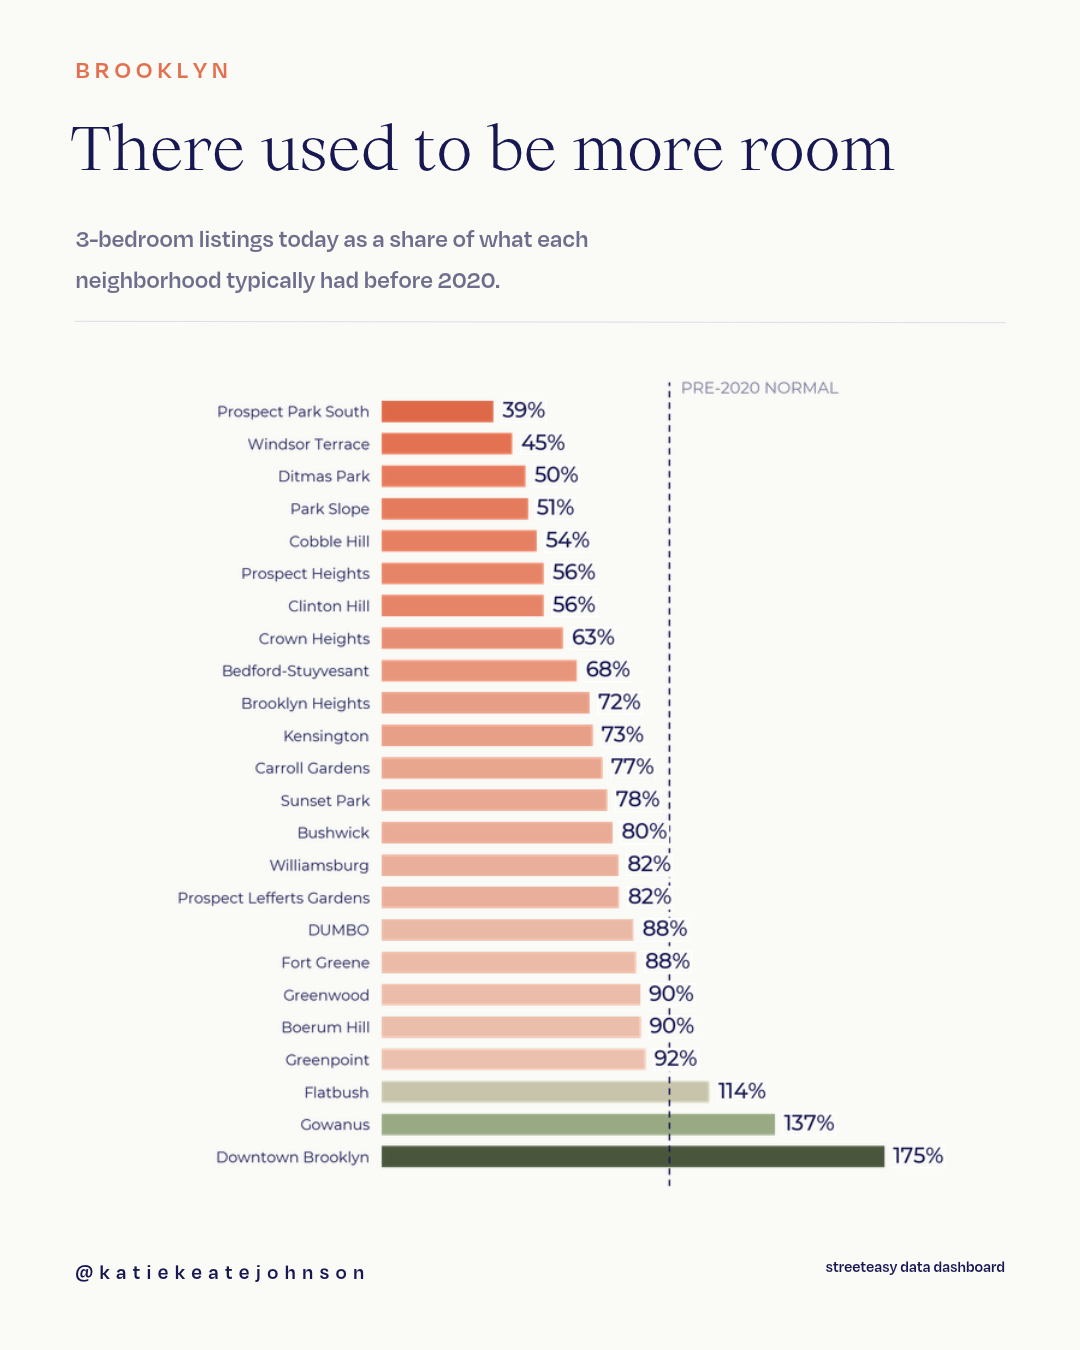
A quarter of Brooklyn’s 3-bedrooms are gone
Brooklyn 3-bedroom rental listings · Today as a share of each neighborhood’s pre-2020 normal
Okay, not gone, but not coming up on the open market either. Brownstone Brooklyn took the biggest hit, while the new construction corridors are above their old levels.
Prospect Park South: 39%
Windsor Terrace: 45%
Ditmas Park: 50%
Park Slope: 51%
Cobble Hill: 54%
Prospect Heights: 56%
Clinton Hill: 56%
Gowanus: 137%
Downtown Brooklyn: 175%
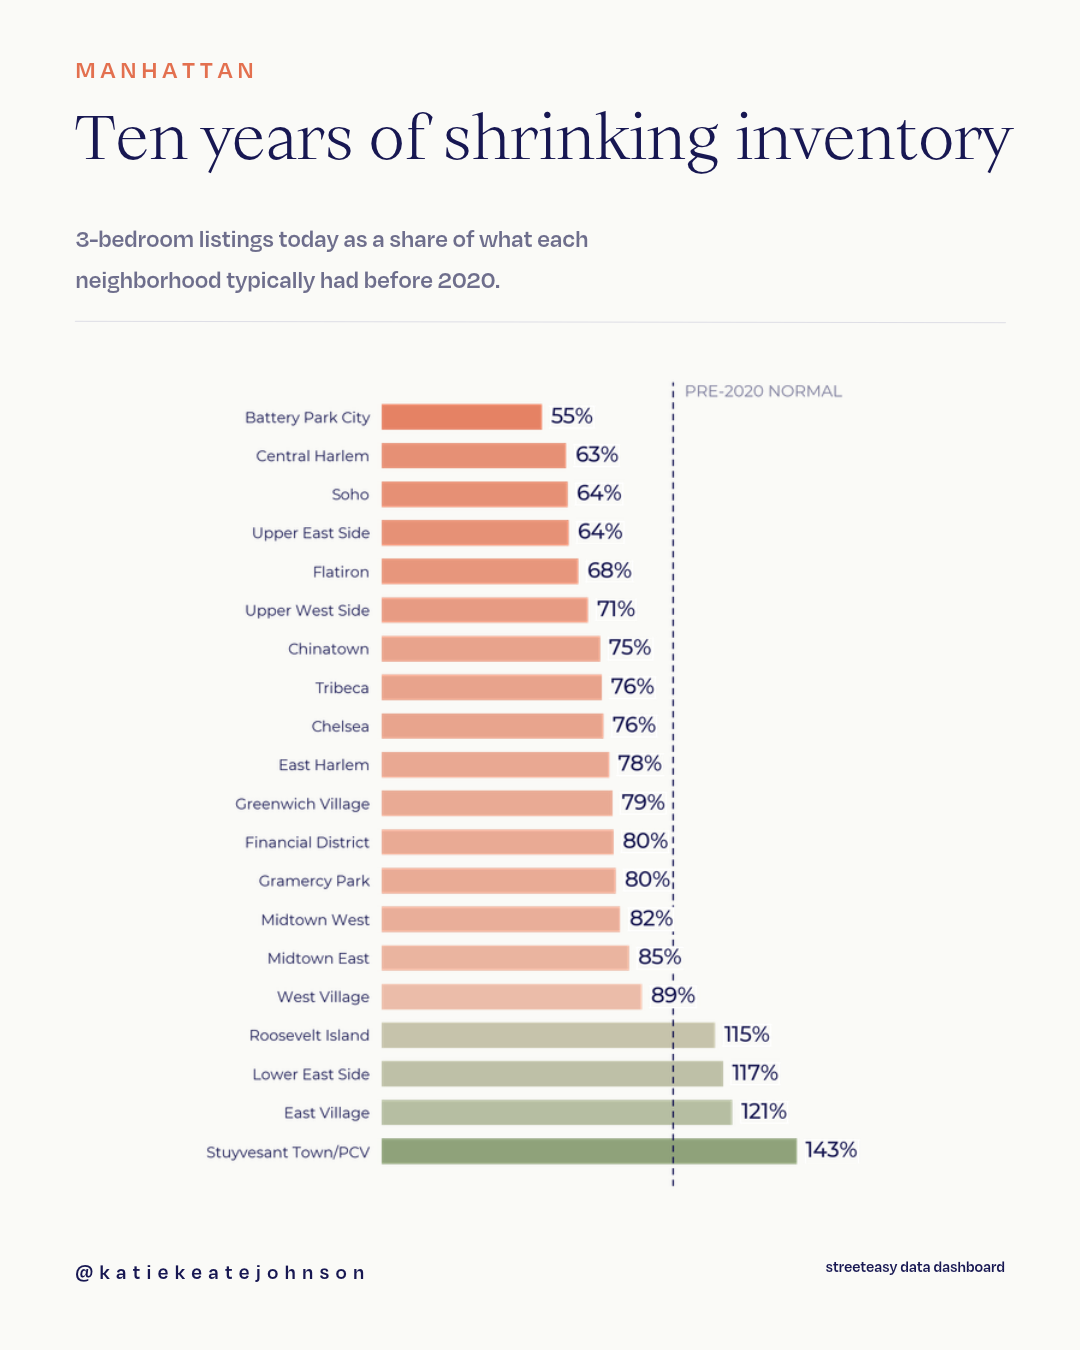
Ten years of shrinking 3-bedroom inventory in Manhattan
Manhattan 3-bedroom rental listings · Today as a share of each neighborhood’s pre-2020 normal
Battery Park City is at 55%, Central Harlem at 63%, and SoHo and the Upper East Side at 64%. Only four neighborhoods are above their old normal: Roosevelt Island, the Lower East Side, the East Village and Stuyvesant Town.
Brooklyn’s comeback has an address
All Brooklyn rental listings, every unit type · Trailing twelve months vs. pre-2020 normal
Brooklyn’s overall listing volume is back to 93% of its pre-2020 normal, but the recovery is not evenly spread. Park Slope is at 47%, and Cobble Hill and Ditmas Park are in the fifties. Gowanus is at 309%. A handful of new construction corridors recovered, and they carried the borough average.
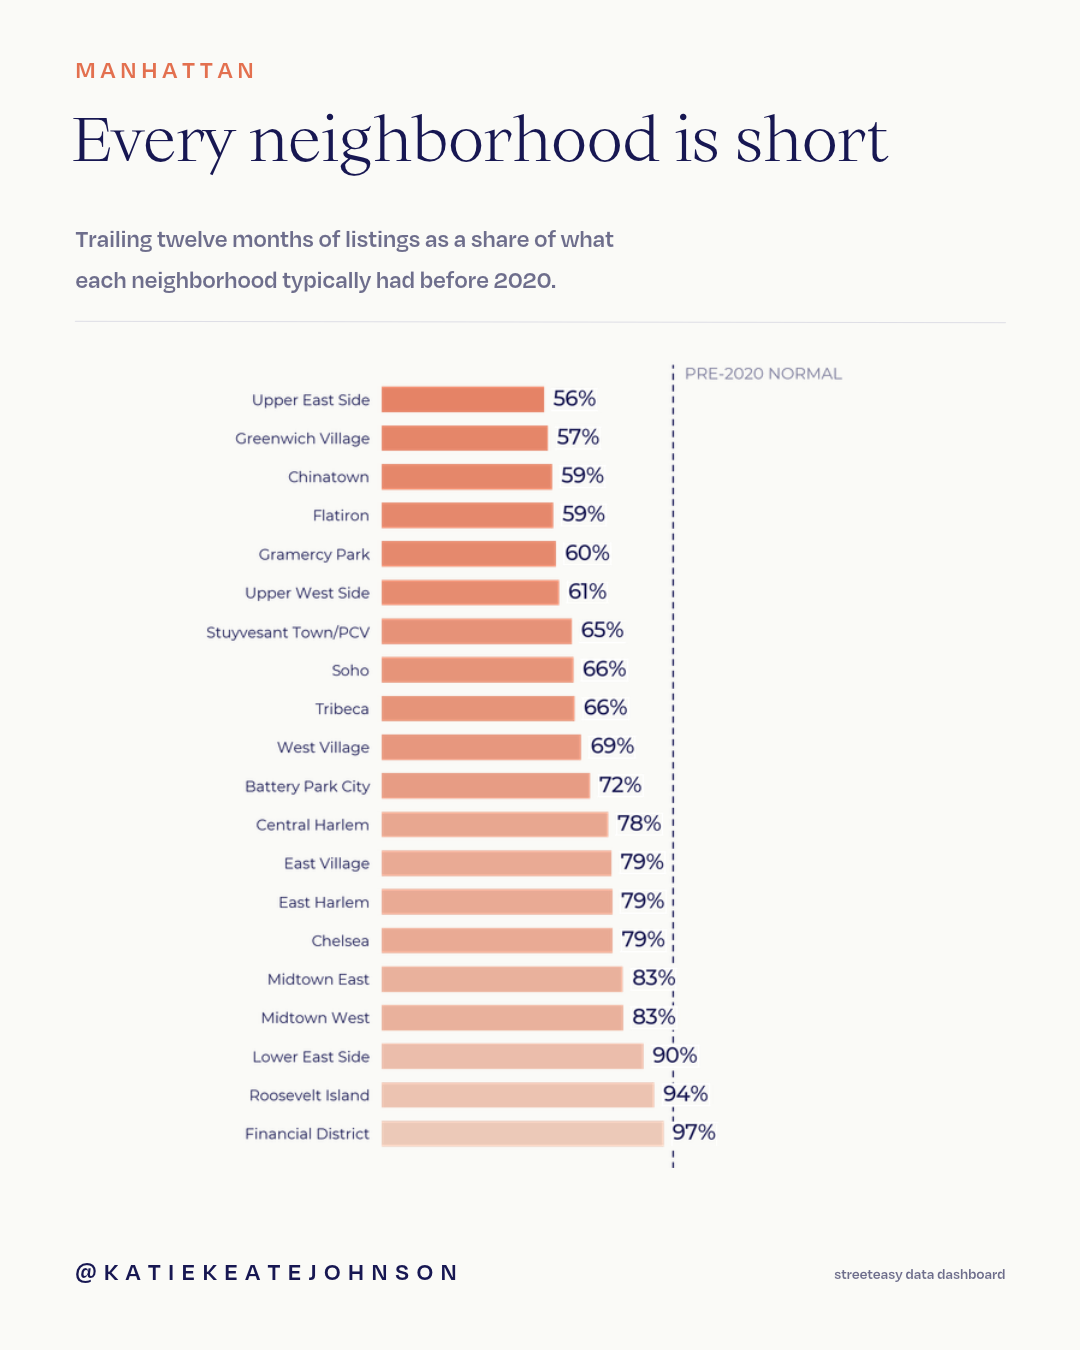
Every Manhattan neighborhood is short
All Manhattan rental listings · Trailing twelve months vs. pre-2020 normal
Manhattan is at 71% overall, and every one of the twenty neighborhoods I tracked is below its own historic level, from the Upper East Side at 56% to the Financial District at 97%.
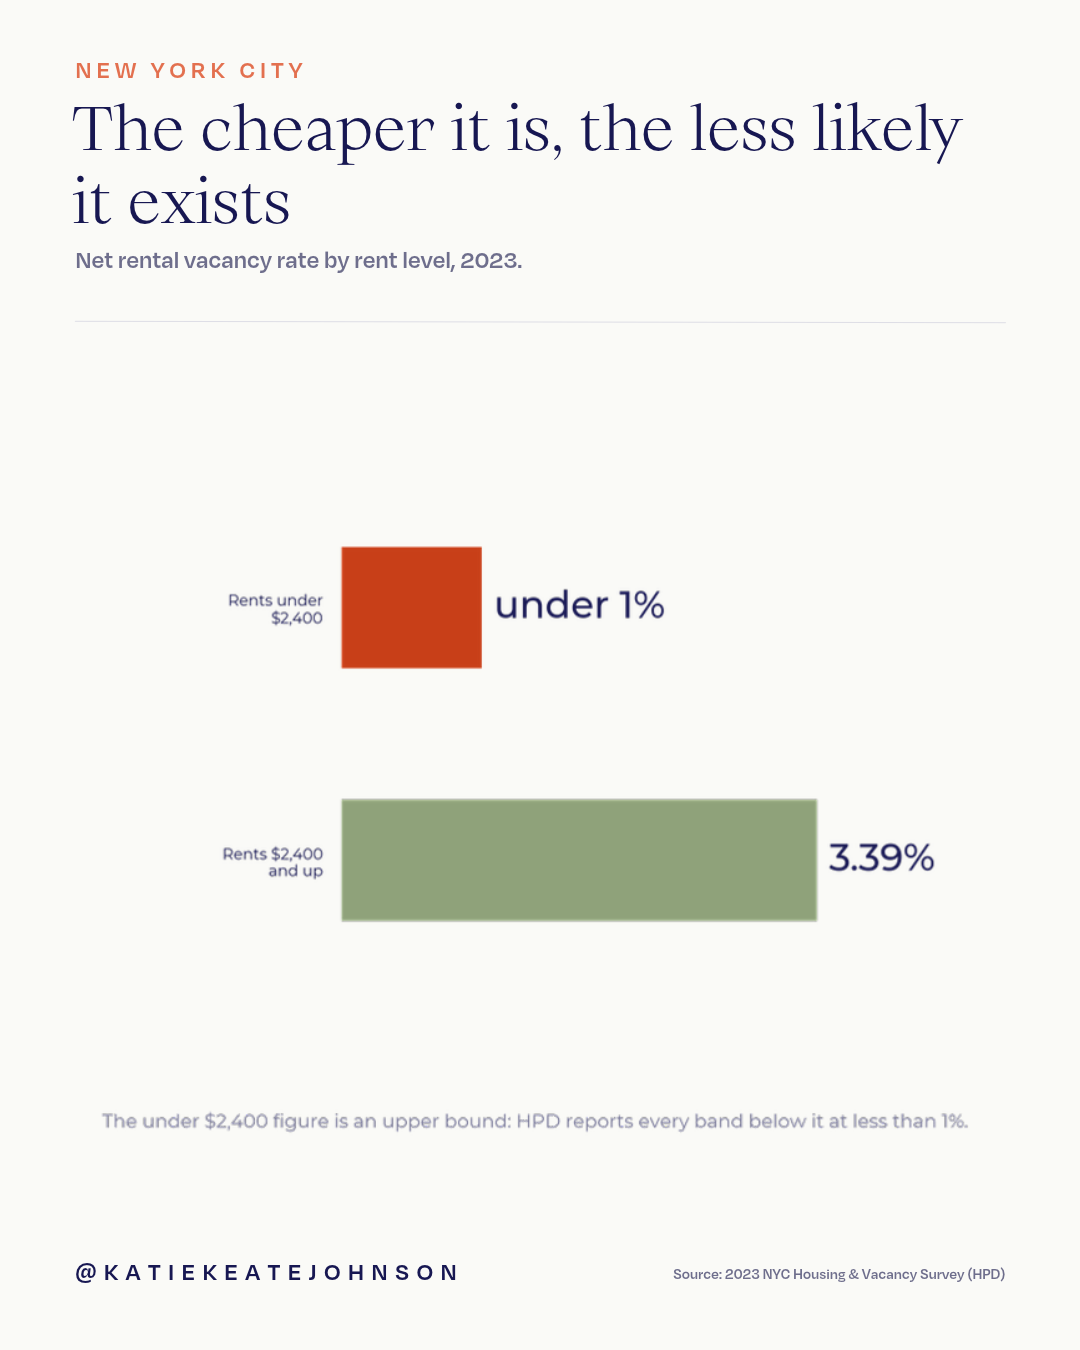
The cheaper it is, the less likely it exists
New York City · Net rental vacancy rate by rent level, 2023
The city’s vacancy rate is 1.41%, the lowest since 1968 and well under the 5% threshold for a declared housing emergency. Below $2,400 a month, vacancy is under 1%. Above it, it is 3.39%.
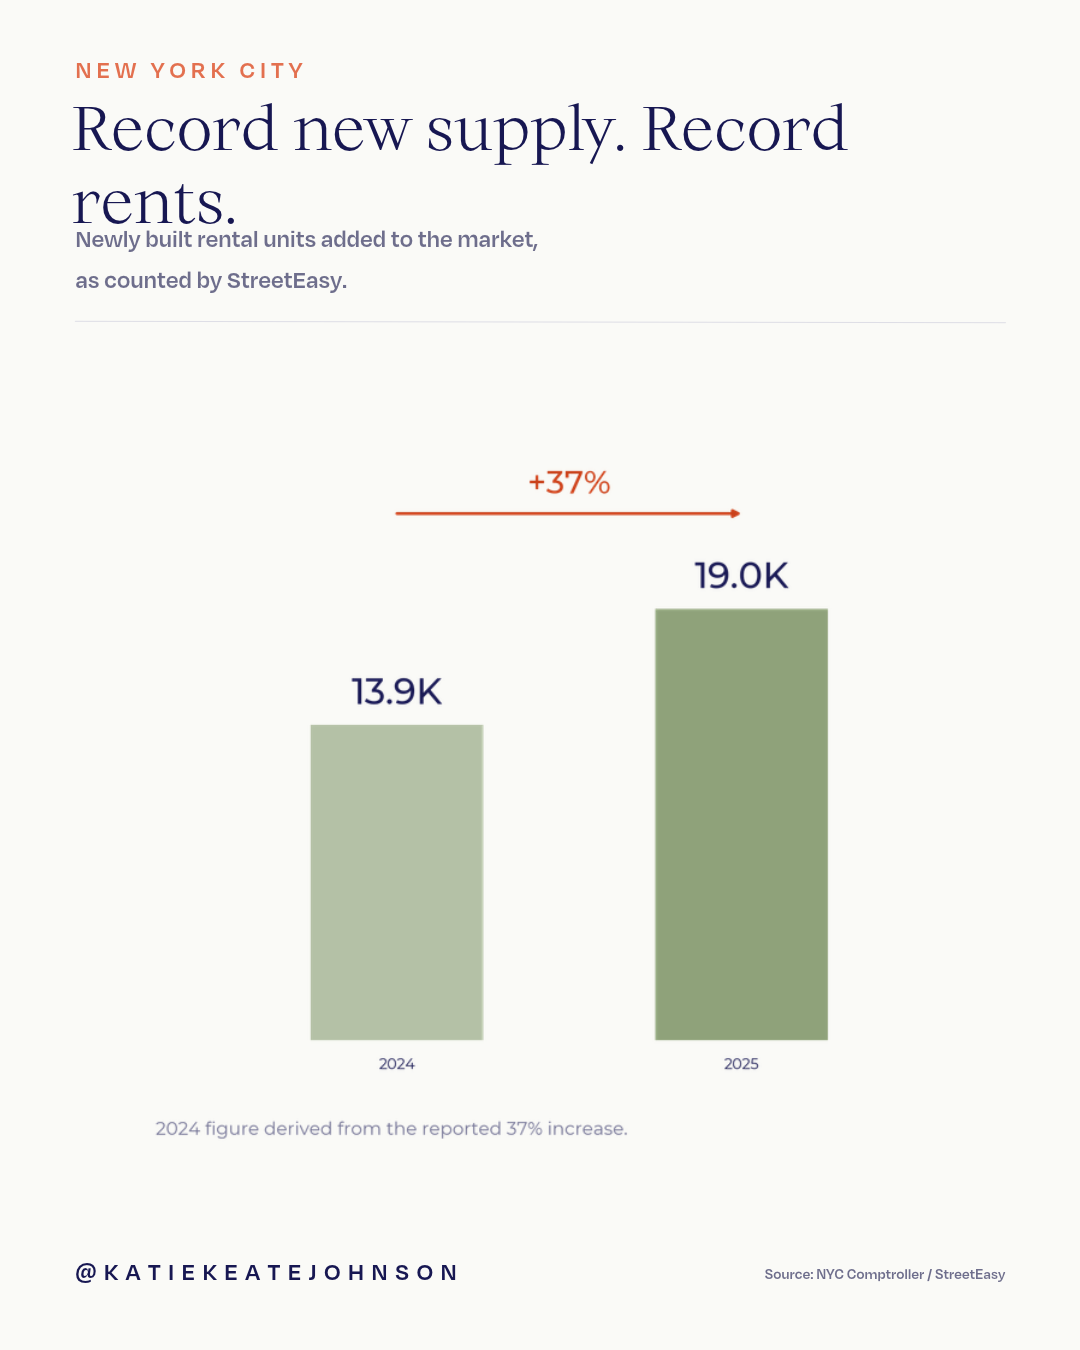
Record new supply. Record rents.
Newly built rental units added to the market, 2024 vs. 2025
2025 was a record year: almost 19,000 newly built rental units came to market, up 37% from about 13,900. Rents were still up nearly 6% from a year earlier and running about 35% above pre-pandemic.
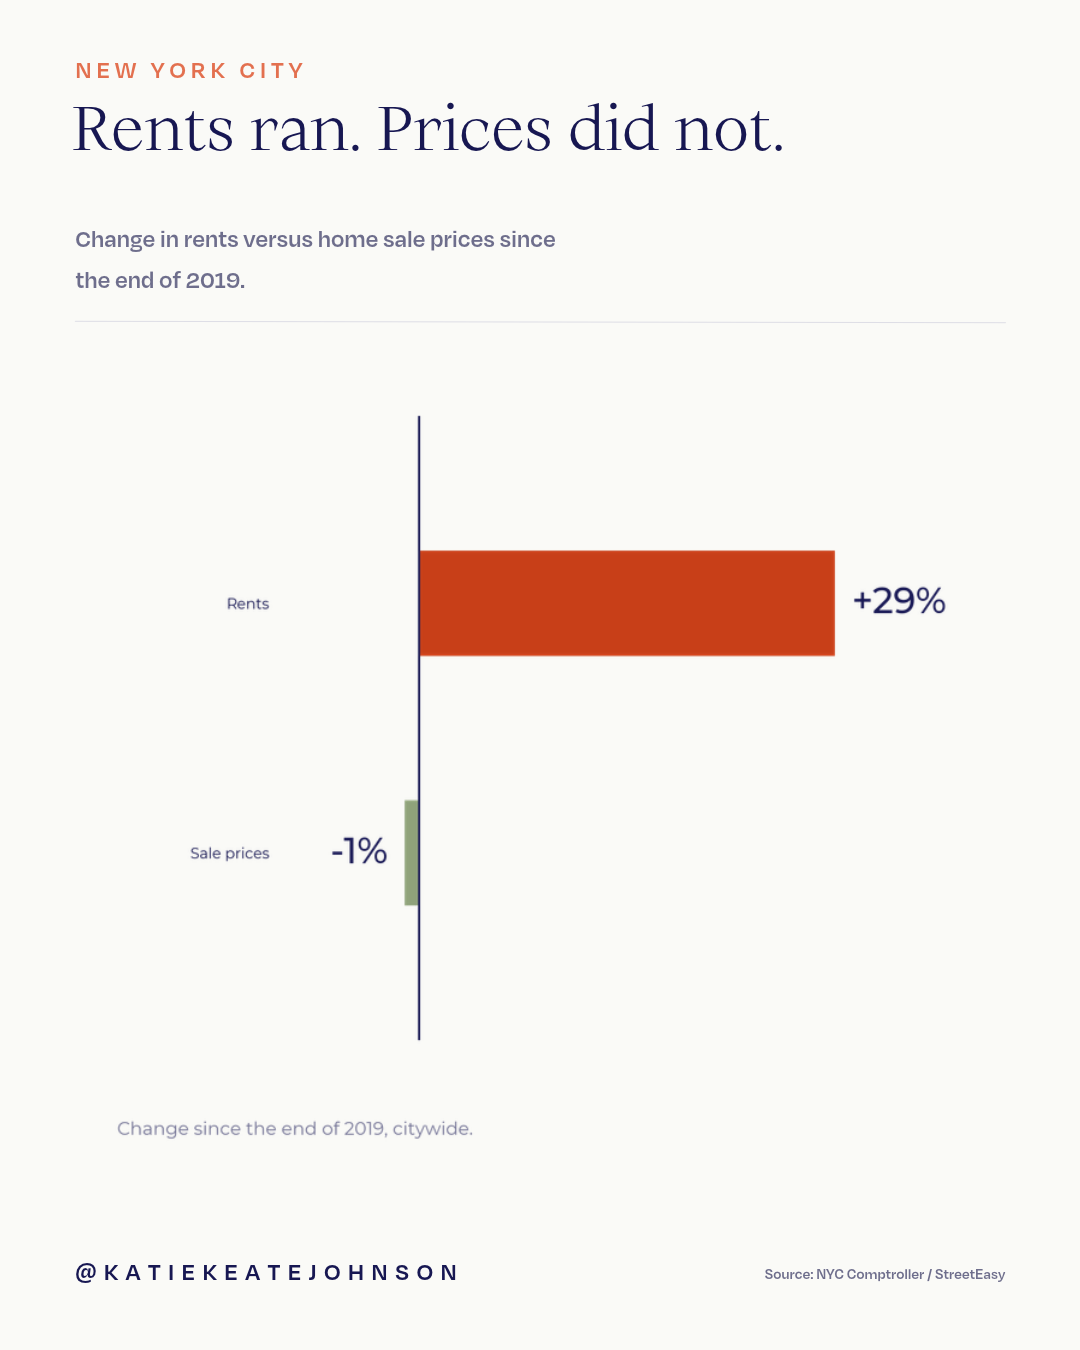
Rents ran. Prices did not.
New York City · Change since the end of 2019
Since the end of 2019, rents are up about 29% citywide while sale prices are down about 1%. This is not a housing cost story. It is a rental story.
Good to Know
Listings are not vacancy. The neighborhood charts measure listings, meaning apartments that came to market. The 1.41% measures vacancy, meaning apartments nobody lives in. They point the same direction, but they are not the same number.
Each neighborhood is compared with itself. 100% means a neighborhood is listing as many apartments as it typically did before 2020. That makes a small neighborhood and a big one comparable.
The under $2,400 figure is an upper bound. The city reports every rent band below it as less than 1%.
Supply counts are rentals only. The new supply figures cover newly built rental units, not condos or co-ops.
Sources: StreetEasy Data Dashboard rental inventory, 2015 to 2026; NYC Housing and Vacancy Survey 2023 (HPD); NYC Comptroller and StreetEasy for new supply and rent change.
-
I’ll be honest: this isn’t my market. I mostly help people buy. But as a New Yorker and a mom raising kids here, these numbers are hard to look at.
If you are a family renting a 3-bedroom in brownstone Brooklyn, you already know how few come up. When one does, be ready to move that week, with your paperwork done.
And if you are weighing renting vs. buying, run the math on your own building. Rents are up about 29% since 2019 while sale prices are flat, so the gap is not what it was a few years ago.
What questions do you want real answers for?
Send me the question you can’t get a straight answer on, about a building, a neighborhood, or the market. I’ll dig into the data and reply with real numbers, no sales pitch. The best ones become a future Data Drop.
KEEP EXPLORING