

DATA DROP - LEASE OR MORTGAGE
Last updated: November 12, 2026
This post is part of the Decode Data Drop, my weekly series where I pull the real numbers behind New York real estate and share what they actually mean for buyers. Receipts, not vibes. A new drop goes up every Thursday on Instagram, so follow along at @katiekeatejohnson to catch the next one.
The question I hear most from renters: would I actually save money if I bought? The usual answer is a neighborhood median, and those make owning look a lot more expensive than renting almost everywhere. The real answer depends on the neighborhood and, even more, on the building.
I pulled a year of closed 2-bedroom sales and rentals in Manhattan and Brooklyn, compared the median rent to the monthly cost to own in each neighborhood, and mapped the results. Then I went looking for the buildings that break the pattern.
Quick Overview
+71%: the median premium to own a 2-bed instead of renting one, across the 41 neighborhoods on the matrix.
4 Brooklyn neighborhoods where owning a 2-bed costs less than renting: Sheepshead Bay (-27%), Gravesend (-17%), Coney Island (-16%) and Midwood (-5%).
-20%: a 2-bed co-op on West 82nd Street costs less to own than the median Upper West Side prewar rent, in a neighborhood where the median premium is +76%.
The Numbers
The Neighborhood Matrix
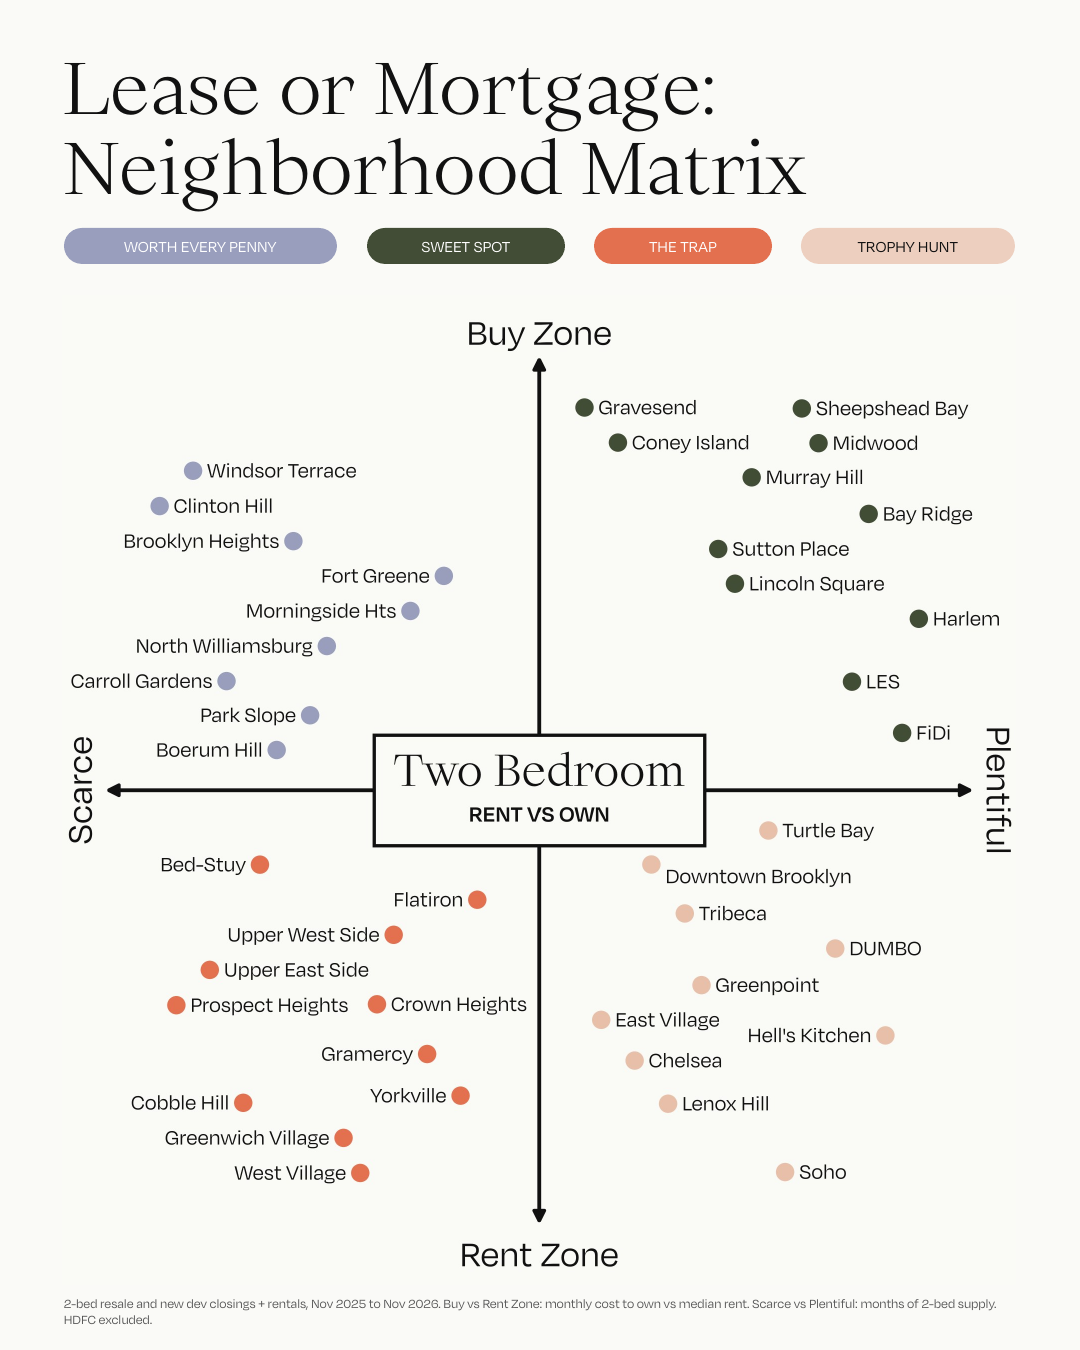
41 neighborhoods · 2-bedroom co-ops and condos · ownership premium vs months of supply
Top to bottom shows how close owning comes to renting (Buy Zone at the top). Left to right shows months of 2-bed resale supply, from Scarce to Plentiful. That splits the map into four groups:
Sweet Spot (owning close to rent, plenty to choose from): Sheepshead Bay, Gravesend, Coney Island, Midwood, Murray Hill, Bay Ridge, Sutton Place, Lincoln Square, Harlem, Lower East Side, Financial District, Downtown Brooklyn
Worth Every Penny (owning close to rent, little to choose from): Windsor Terrace, Clinton Hill, Brooklyn Heights, Fort Greene, Morningside Heights, North Williamsburg, Carroll Gardens, Park Slope, Boerum Hill
Trophy Hunt (big premium, plenty to choose from): Turtle Bay, Tribeca, DUMBO, Greenpoint, East Village, Hell's Kitchen, Chelsea, Lenox Hill, Soho
The Trap (big premium, little to choose from): Bed-Stuy, Flatiron, Upper West Side, Upper East Side, Prospect Heights, Crown Heights, Gramercy, Yorkville, Cobble Hill, Greenwich Village, West Village
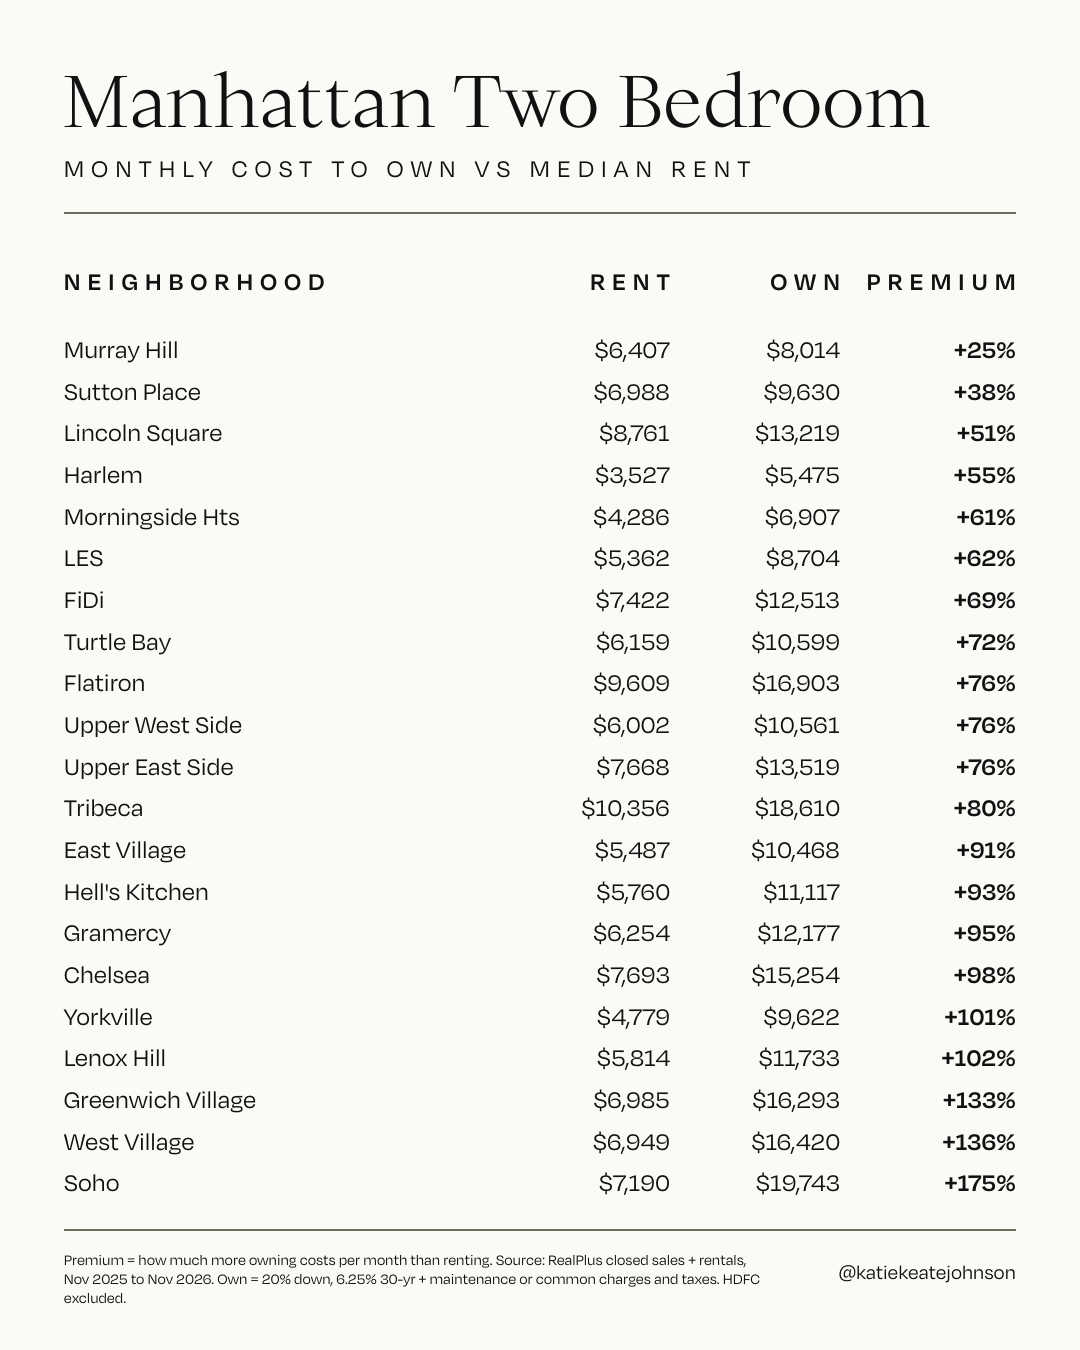
Manhattan: owning a 2-bed costs 25% to 175% more than renting
Manhattan · 2-bedroom · median rent vs monthly cost to own
Murray Hill and Sutton Place come closest. Downtown and the Village sit at the other end, where owning costs more than double the rent. Smallest premium to largest:
Murray Hill: $8,014 to own vs $6,407 rent (+25%)
Sutton Place: $9,630 to own vs $6,988 rent (+38%)
Lincoln Square: $13,219 to own vs $8,761 rent (+51%)
Harlem: $5,475 to own vs $3,527 rent (+55%)
Morningside Heights: $6,907 to own vs $4,286 rent (+61%)
Lower East Side: $8,704 to own vs $5,362 rent (+62%)
Financial District: $12,513 to own vs $7,422 rent (+69%)
Turtle Bay: $10,599 to own vs $6,159 rent (+72%)
Flatiron: $16,903 to own vs $9,609 rent (+76%)
Upper East Side: $13,519 to own vs $7,668 rent (+76%)
Upper West Side: $10,561 to own vs $6,002 rent (+76%)
Tribeca: $18,610 to own vs $10,356 rent (+80%)
East Village: $10,468 to own vs $5,487 rent (+91%)
Hell's Kitchen: $11,117 to own vs $5,760 rent (+93%)
Gramercy: $12,177 to own vs $6,254 rent (+95%)
Chelsea: $15,254 to own vs $7,693 rent (+98%)
Yorkville: $9,622 to own vs $4,779 rent (+101%)
Lenox Hill: $11,733 to own vs $5,814 rent (+102%)
Greenwich Village: $16,293 to own vs $6,985 rent (+133%)
West Village: $16,420 to own vs $6,949 rent (+136%)
Soho: $19,743 to own vs $7,190 rent (+175%)
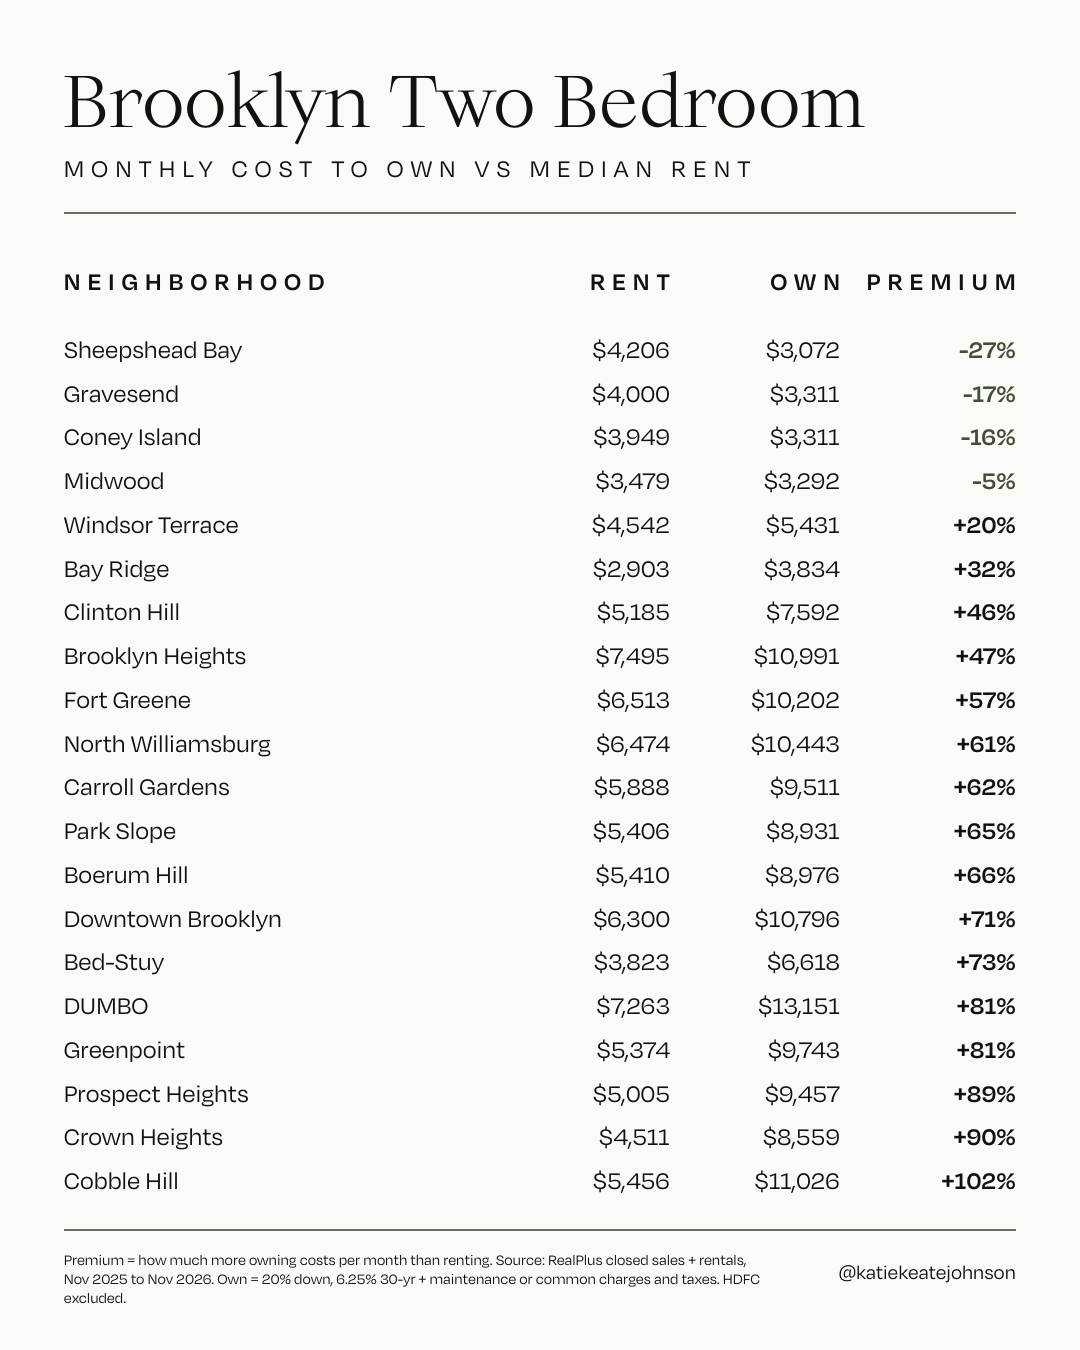
Brooklyn: four neighborhoods where owning wins
Brooklyn · 2-bedroom · median rent vs monthly cost to own
In South Brooklyn, a 2-bed costs less to own than to rent. Most of brownstone Brooklyn runs 46% to 102% more to own. Smallest premium to largest:
Sheepshead Bay: $3,072 to own vs $4,206 rent (-27%)
Gravesend: $3,311 to own vs $4,000 rent (-17%)
Coney Island: $3,311 to own vs $3,949 rent (-16%)
Midwood: $3,292 to own vs $3,479 rent (-5%)
Windsor Terrace: $5,431 to own vs $4,542 rent (+20%)
Bay Ridge: $3,834 to own vs $2,903 rent (+32%)
Clinton Hill: $7,592 to own vs $5,185 rent (+46%)
Brooklyn Heights: $10,991 to own vs $7,495 rent (+47%)
Fort Greene: $10,202 to own vs $6,513 rent (+57%)
North Williamsburg: $10,443 to own vs $6,474 rent (+61%)
Carroll Gardens: $9,511 to own vs $5,888 rent (+62%)
Park Slope: $8,931 to own vs $5,406 rent (+65%)
Boerum Hill: $8,976 to own vs $5,410 rent (+66%)
Downtown Brooklyn: $10,796 to own vs $6,300 rent (+71%)
Bed-Stuy: $6,618 to own vs $3,823 rent (+73%)
DUMBO: $13,151 to own vs $7,263 rent (+81%)
Greenpoint: $9,743 to own vs $5,374 rent (+81%)
Prospect Heights: $9,457 to own vs $5,005 rent (+89%)
Crown Heights: $8,559 to own vs $4,511 rent (+90%)
Cobble Hill: $11,026 to own vs $5,456 rent (+102%)
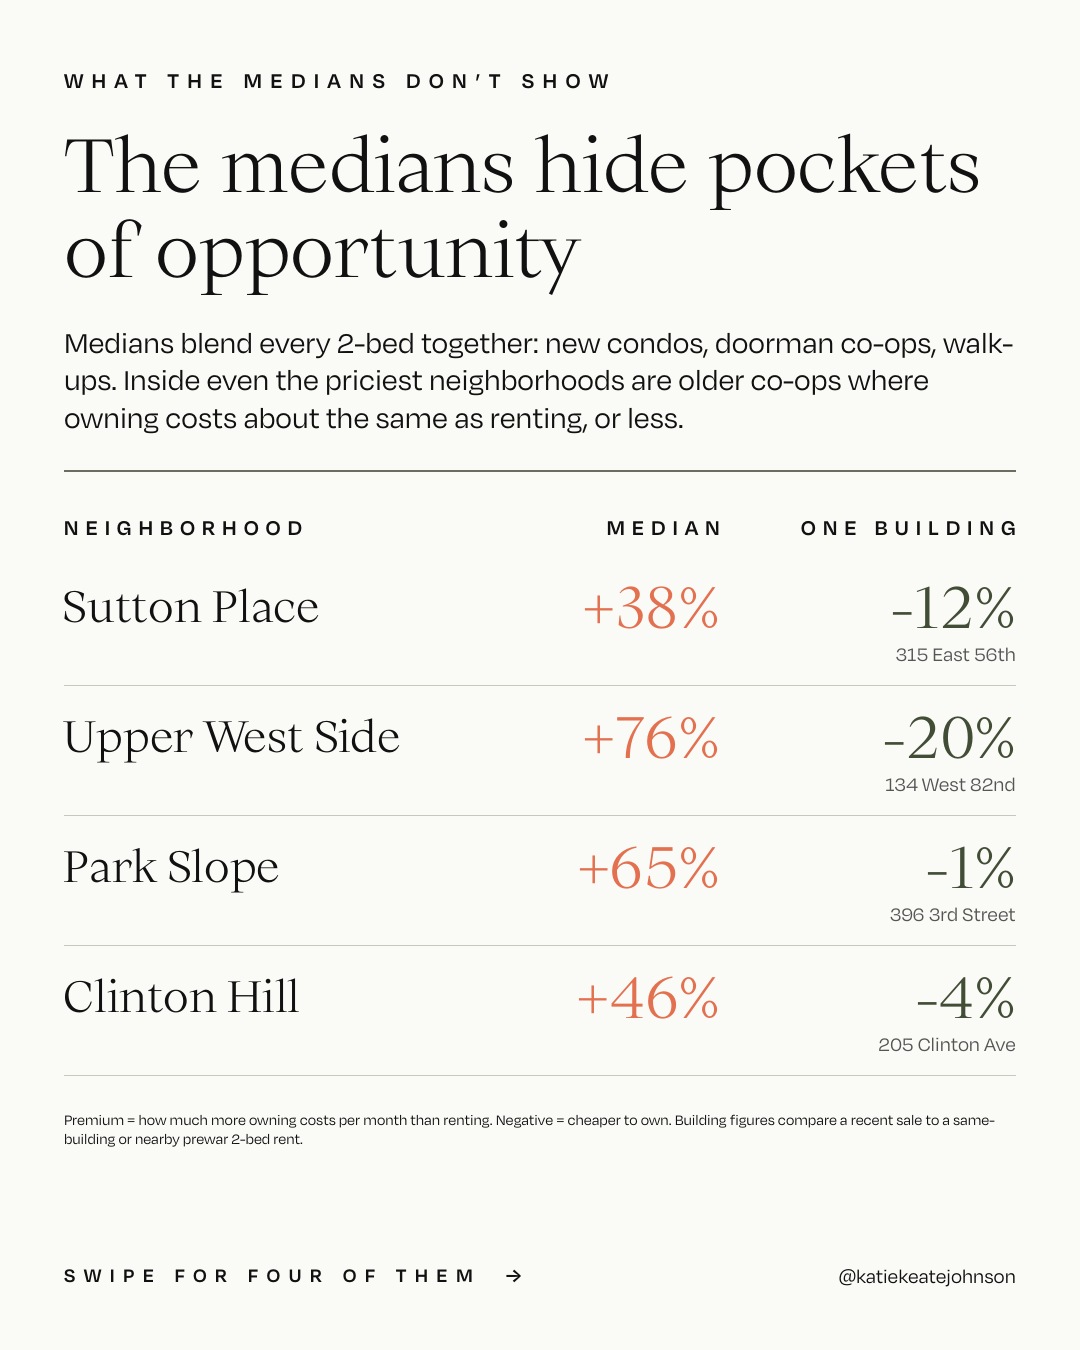
The medians hide pockets of opportunity
4 neighborhoods · median premium vs one recent sale
Medians blend new condos, doorman co-ops and walk-ups together. Inside each of these neighborhoods is an older co-op where owning came in under the rent.
Sutton Place: median +38%, 315 East 56th Street -12%
Upper West Side: median +76%, 134 West 82nd Street -20%
Park Slope: median +65%, 396 3rd Street -1%
Clinton Hill: median +46%, 205 Clinton Avenue -4%
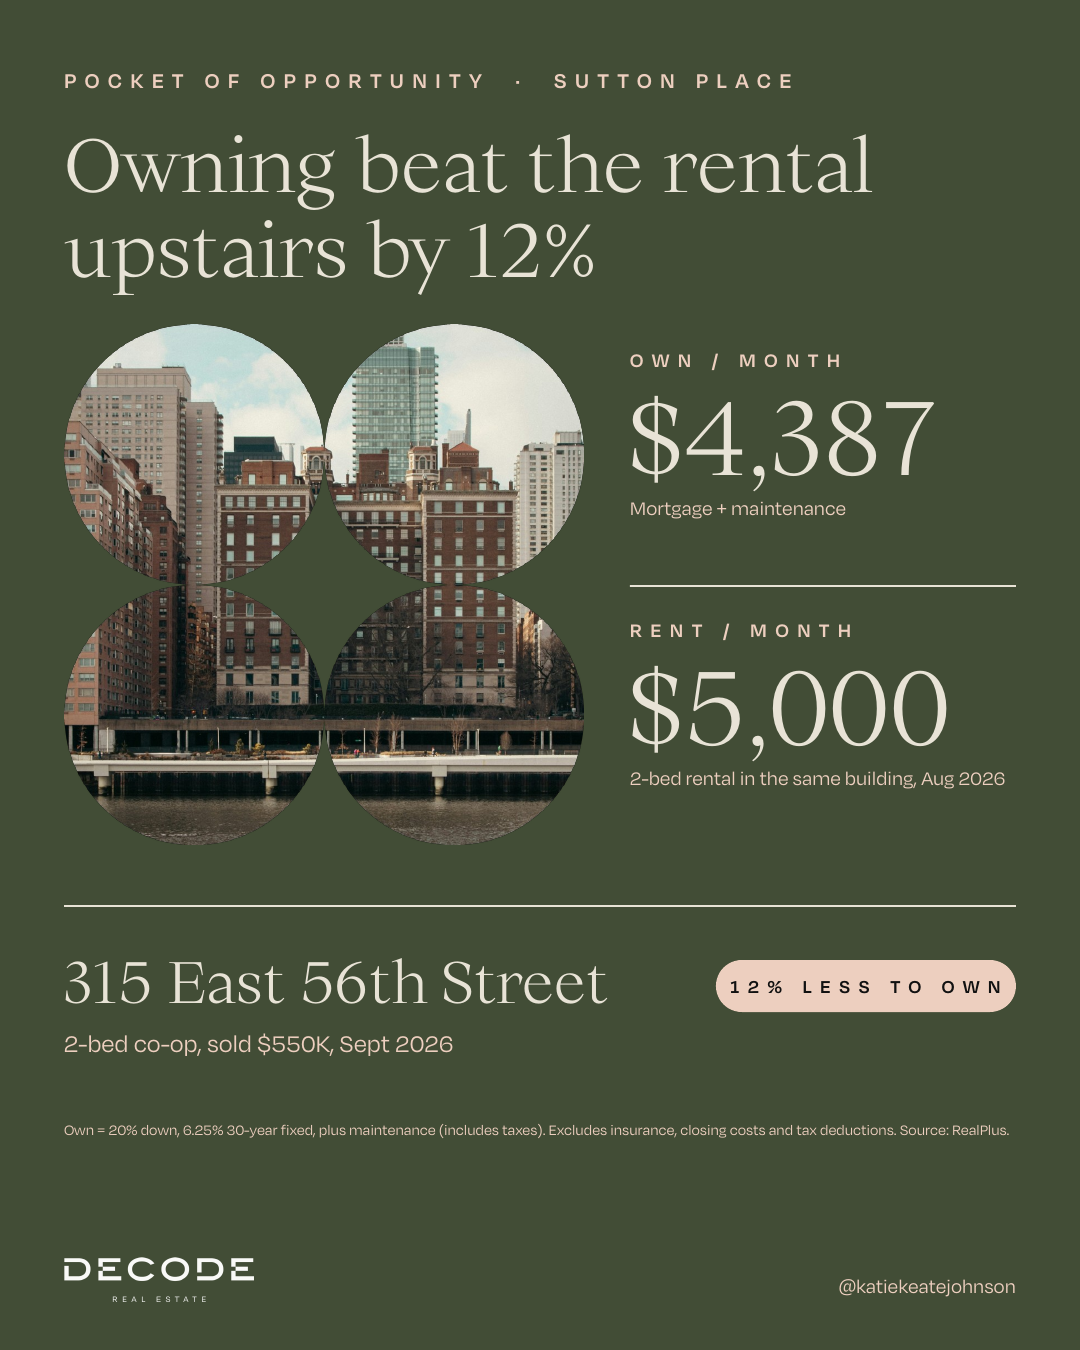
Sutton Place: 315 East 56th Street
2-bed co-op · sold $550K, Sept 2026 · $4,387/mo to own vs $5,000/mo rent
Owning ran 12% less than a 2-bed rental in the same building, leased in August 2026. Maintenance is $1,678 a month.
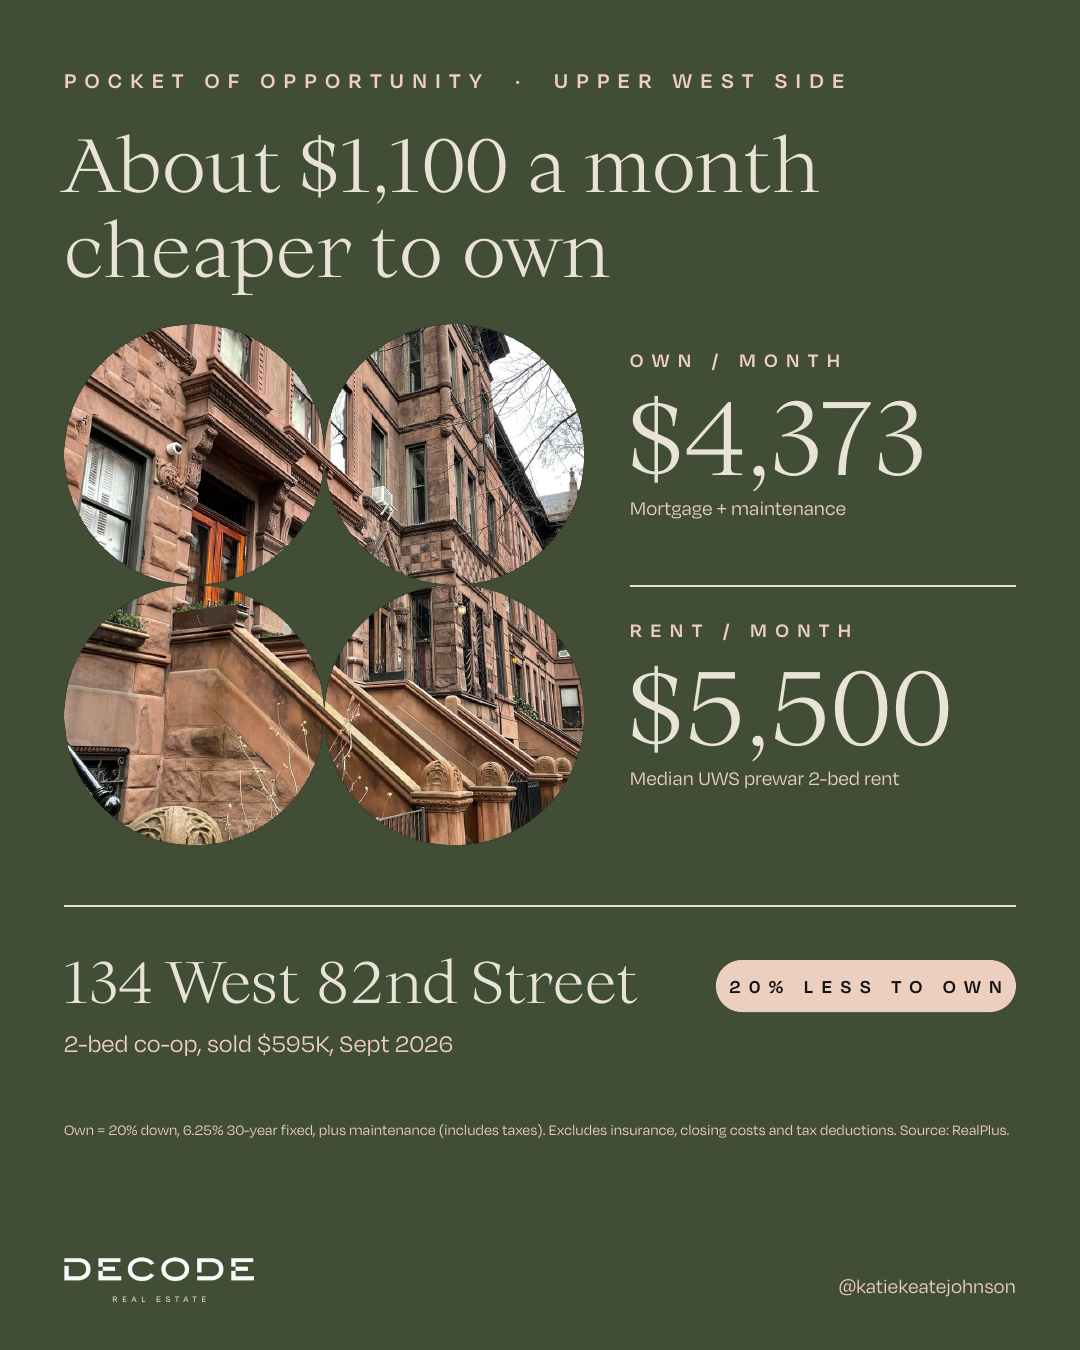
Upper West Side: 134 West 82nd Street
2-bed co-op · sold $595K, Sept 2026 · $4,373/mo to own vs $5,500/mo rent
About $1,100 a month less than the median Upper West Side prewar 2-bed rent. It's a smaller 2-bed in a townhouse-style building from 1890, with $1,442 maintenance.
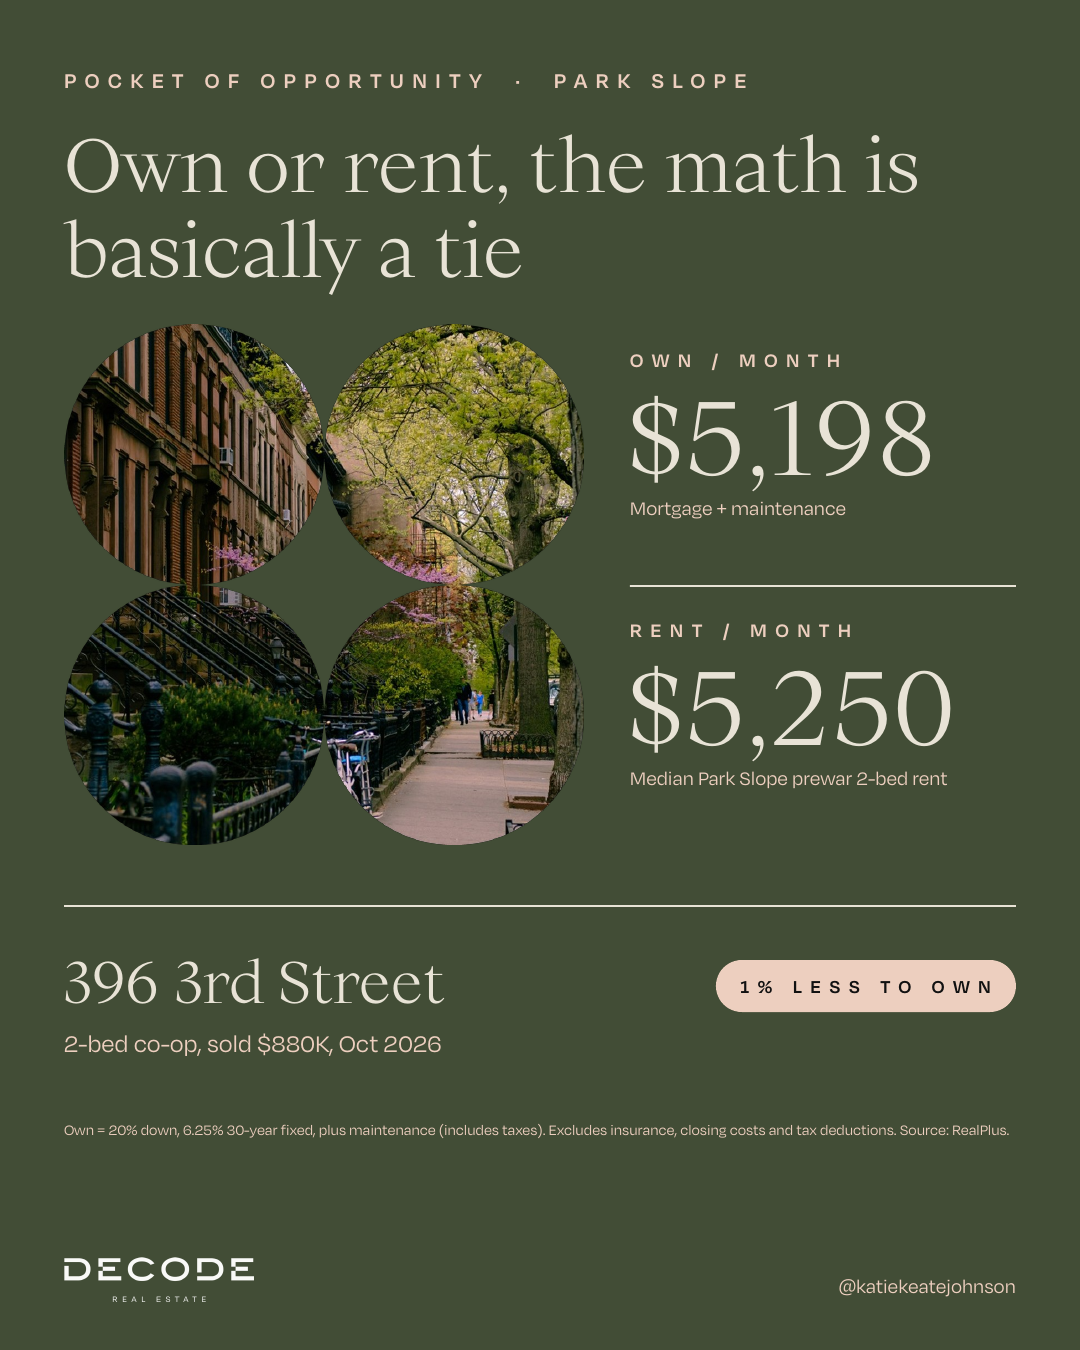
Park Slope: 396 3rd Street
2-bed co-op · sold $880K, Oct 2026 · $5,198/mo to own vs $5,250/mo rent
Basically a tie with the median Park Slope prewar 2-bed rent. Low maintenance ($863, with heat and hot water included) keeps this walk-up co-op's monthly close to rent.
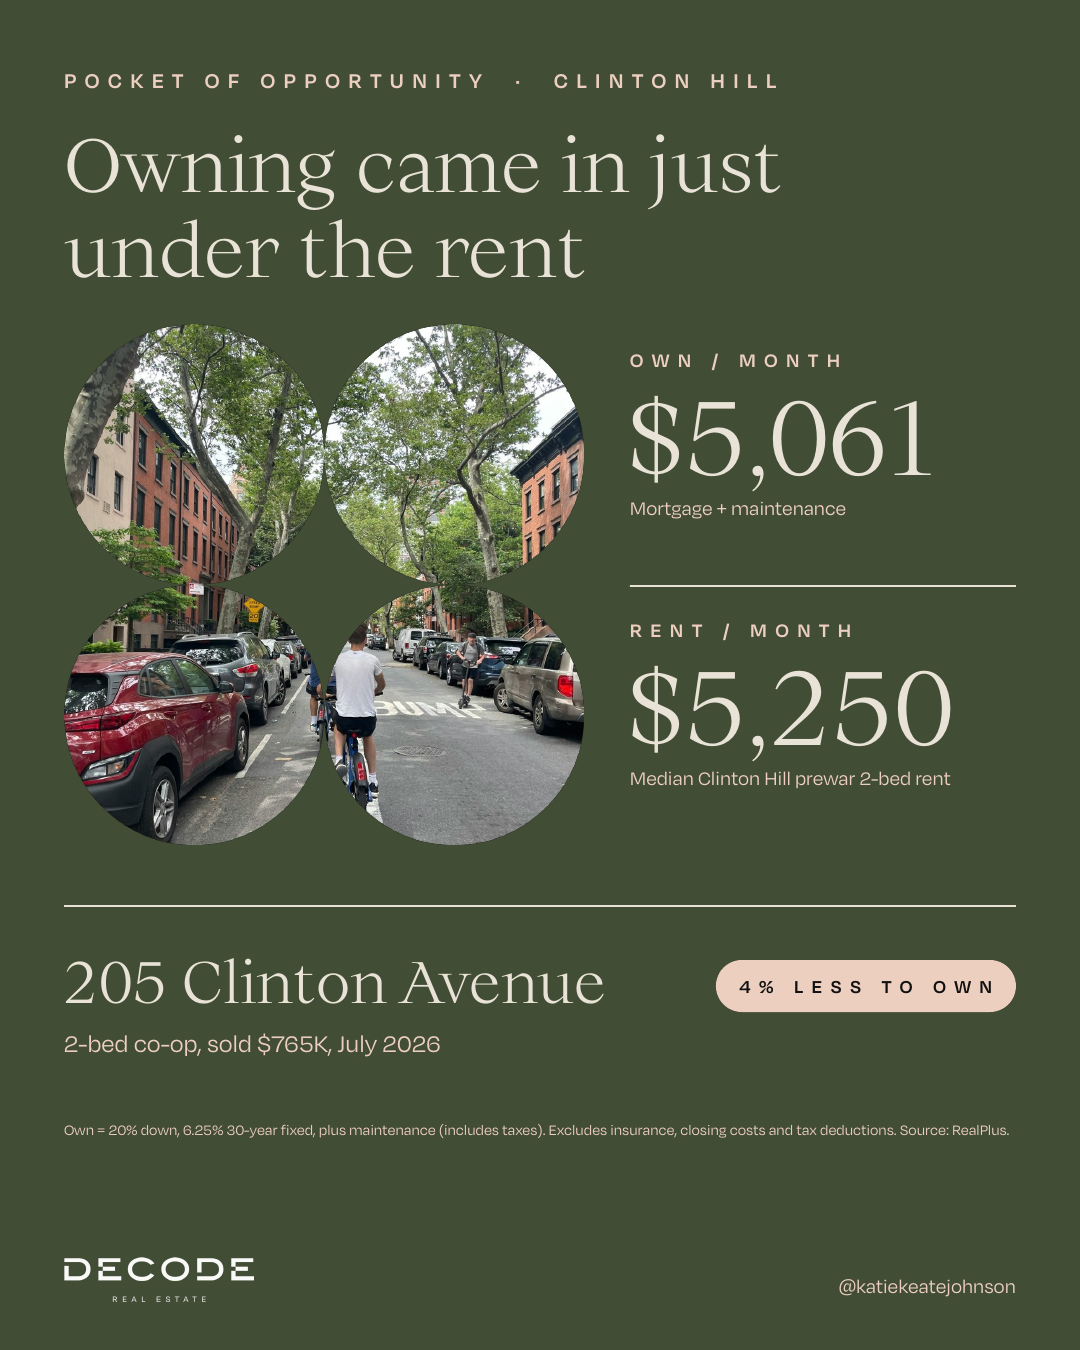
Clinton Hill: 205 Clinton Avenue
2-bed co-op · sold $765K, July 2026 · $5,061/mo to own vs $5,250/mo rent
4% under the median Clinton Hill prewar 2-bed rent, in the Clinton Hill Co-ops. Maintenance is $1,293. The listing describes it as a converted 2-bedroom.
Good to Know
Cost to own = 20% down, a 6.25% 30-year fixed mortgage, plus maintenance or common charges and taxes. It leaves out insurance, closing costs and tax deductions, and doesn't count the equity you build.
Medians, not averages. Rent is the median 2-bed rent in each neighborhood. Own is the median monthly cost of closed 2-bed sales.
HDFC co-ops are excluded. They're income-restricted, so they aren't a fair comparison.
New development is included. Sponsor sales with high common charges can pull a neighborhood's median up.
The matrix shows 41 neighborhoods with at least 20 sales and 30 rentals. Supply is months of 2-bed resale inventory.
Building examples compare one recent sale to a 2-bed rental in the same building (Sutton Place) or to the median prewar 2-bed rent in the neighborhood (the other three).
Source: RealPlus closed sales and rentals, November 12, 2025 to November 11, 2026 (5,207 2-bedroom sales).
-
If you're renting a 2-bed and assuming buying is out of reach, look at the building, not the neighborhood median. The medians get pulled up by new condos with big common charges. Older co-ops with low maintenance are where owning and renting meet.
The tradeoffs are real: a co-op means a board, down payment rules and less freedom to rent it out later. And a lower monthly doesn't mean it's cheaper to get in the door, so run your cash to close next to the monthly.
These pockets don't sit around. Three of these four sold over asking. Tell me the neighborhoods you're watching and I'll flag the next one.
What questions do you want real answers for?
Send me the question you can't get a straight answer on, about a building, a neighborhood, or the market. I'll dig into the data and reply with real numbers, no sales pitch. The best ones become a future Data Drop.
KEEP EXPLORING